We live in the age of Big Data: extremely large data sets collected from multiple sources by scientists, businesses, nonprofit organizations, government agencies, and others. Data visualization—the practice of representing data—is one of the primary tools used to make these massive amounts of data understandable, transforming them into knowledge. Within the sciences, data visualization conveys information in a compelling manner; in art, it transforms information into a canvas for creative expression. Over the past 20 years, artists and designers have incorporated data visualization into their work, both as a way of critiquing it and as a new form of storytelling. Seeing the Unseeable explores how art, science, and design have become integrated in the work of both scientists and contemporary artists.
Artists in the Exhibition:
Refik Anadol
Laurie Frick
Hyojung Seo
George Legrady
Rafael Lozano Hemmer
Giorgia Lupi and Ehren Shorday
Iñigo Manglano-Ovalle
Sarah Morris
Data to Discovery: Santiago Lombeyda and Hillary Mushkin
Mimi Ọnụọha
Semiconductor: Ruth Jarman and Joe Gerhardt
Linnéa Gabriella Spransy
Mika Tajima
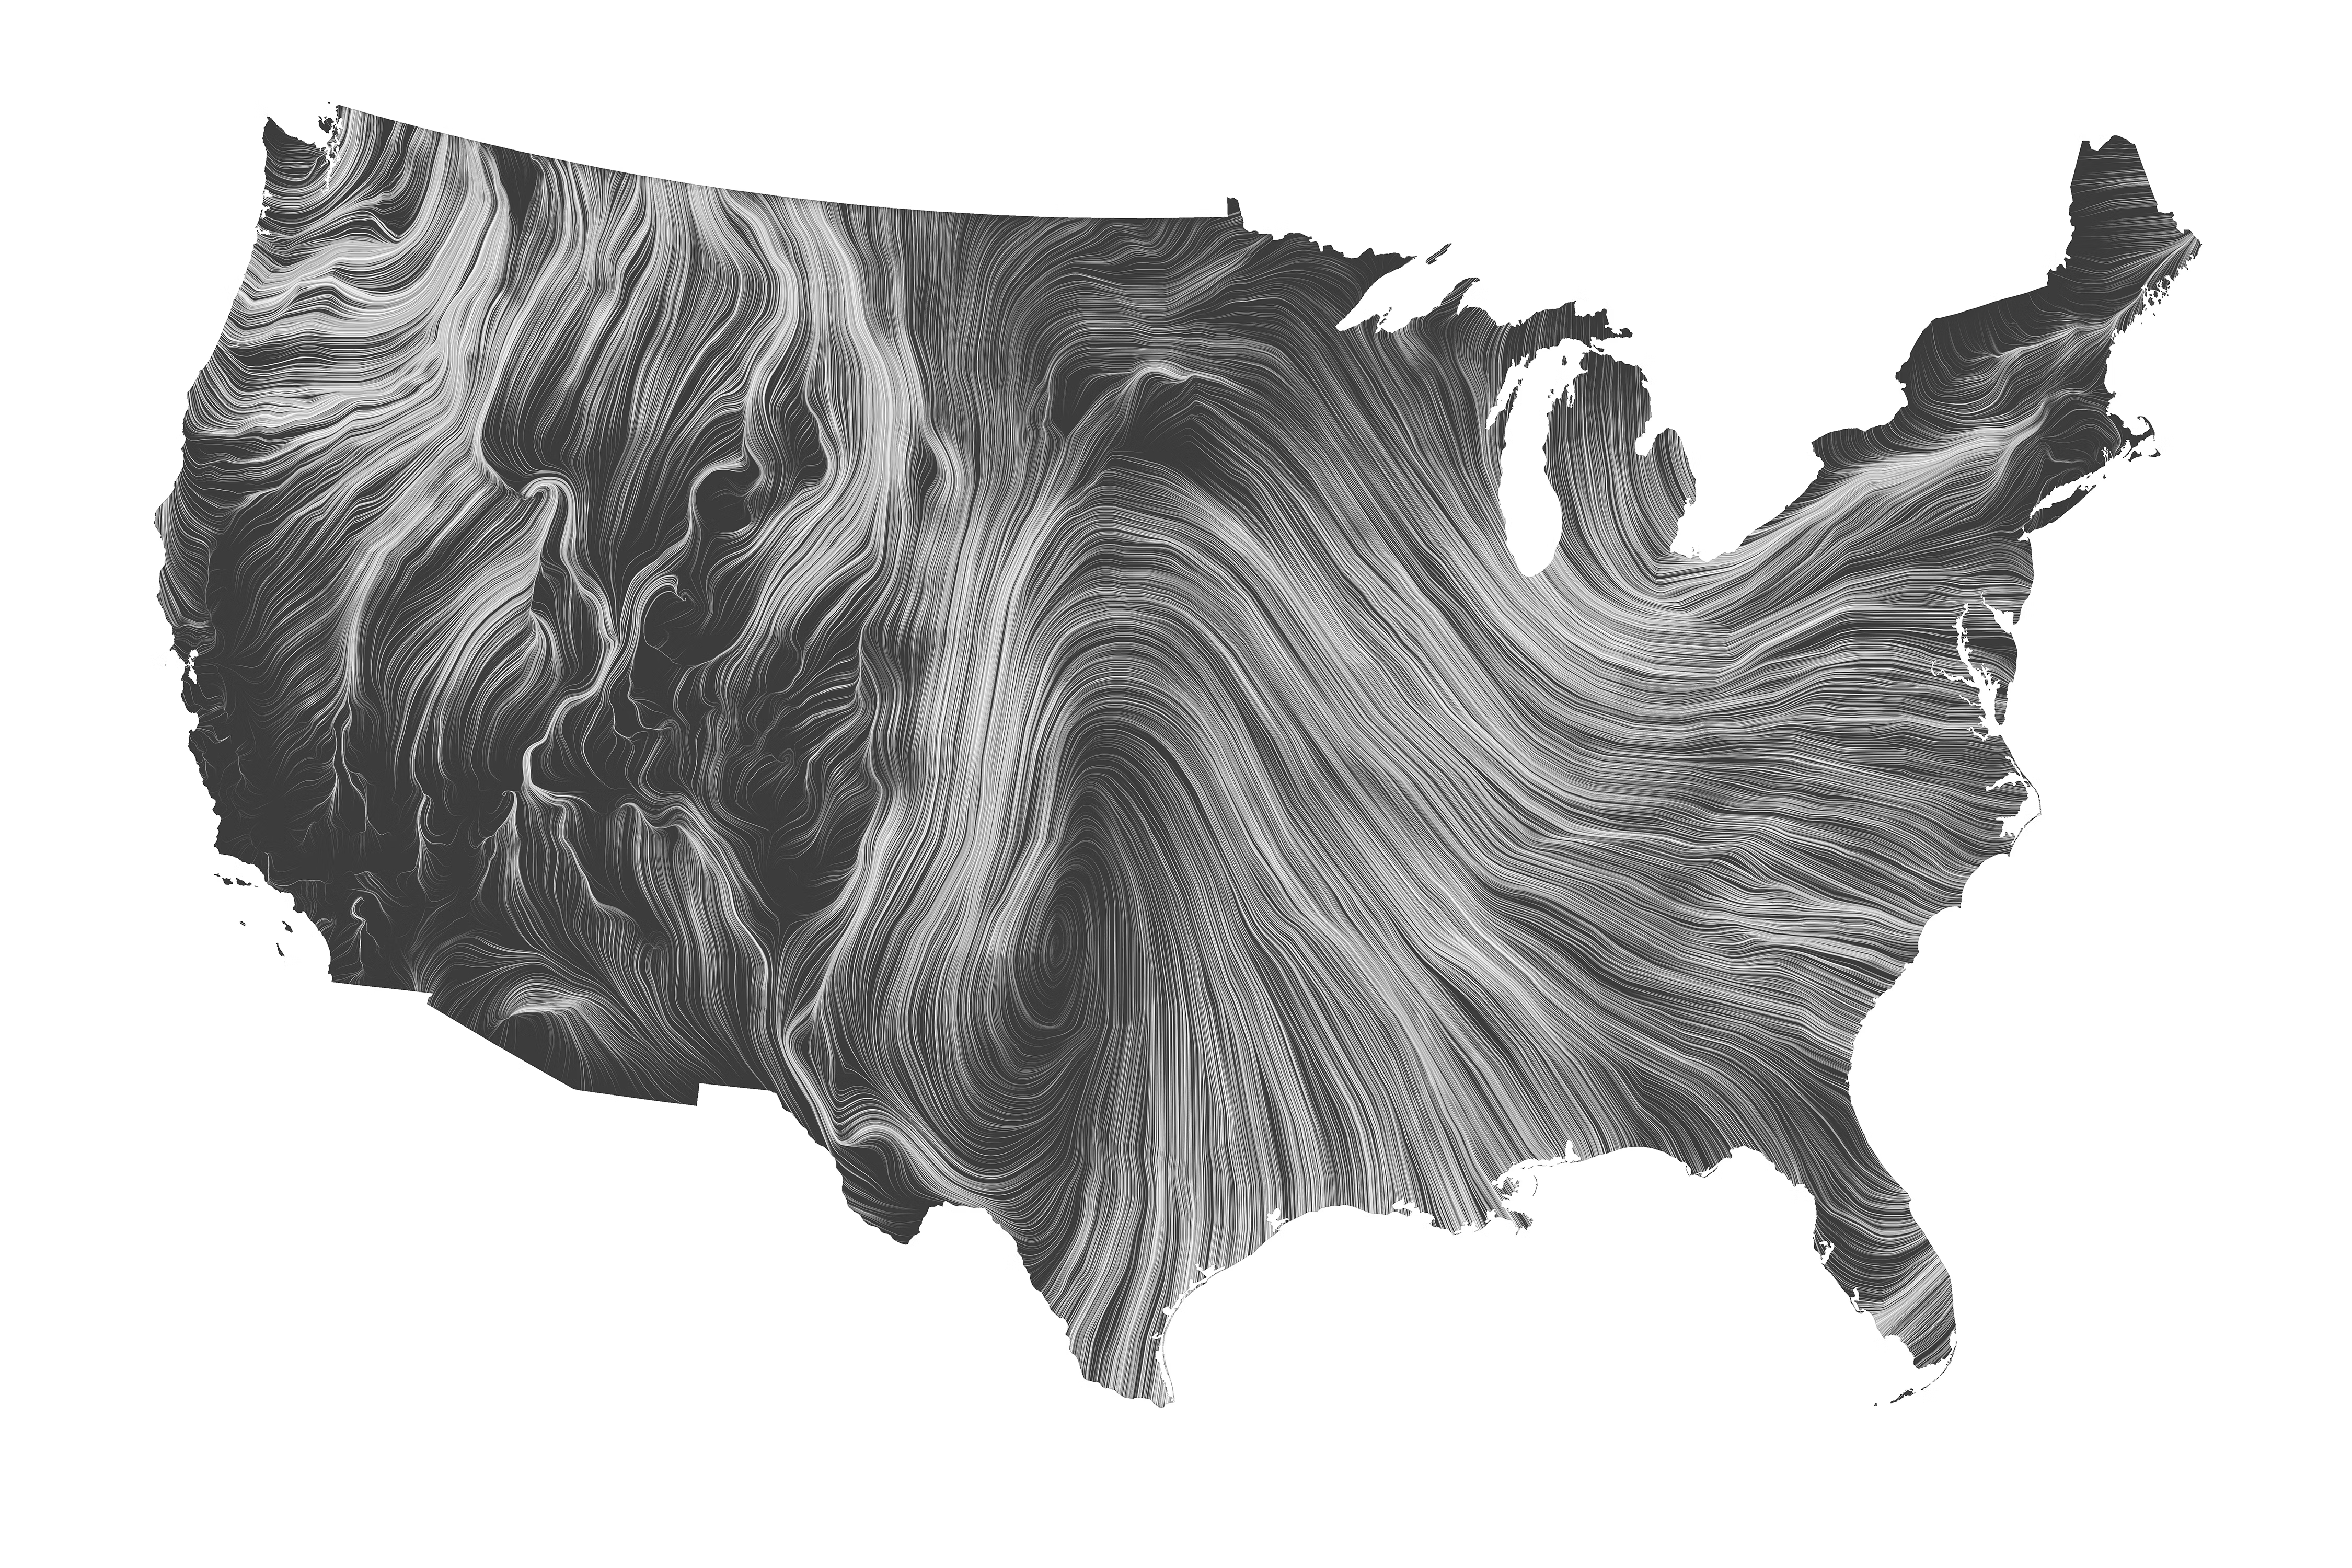
Fernanda Viégas and Martin Wattenberg
Peggy Weil
Christine Wertheim, Margaret Wertheim and The Institute for Figuring
Seeing the Unseeable: Data, Design, Art Higher Ed Curricular Resource
"Wind Map, Visualization of wind patterns in the US on November 2," 2013, Fernanda Viégas and Martin Wattenberg. Courtesy of Fernanda Viégas and Martin Wattenberg. ©Fernanda Viégas and Martin Wattenberg.

Campus Map
ArtCenter College of Design